ShareThis
Friday, March 12, 2010
Presentation - V
As we have already learnt that Presentation is nothing but a more sophisticated form of Visual Communication, now let us try to understand the RULES for any visual communication. No matter what the tool or media you choose to use.
The purpose of a presentation is to present information — not devastate the audience with a demonstration of all the software tools and tricks. The software is merely a tool. Avoid the typical pitfalls of presentations with purpose, simplicity, and consistency.
Rule 1 – Form follows function
Resolve what your presentation is meant for – to entertain, to inform, to persuade, or to sell. Is a jocular or a more official approach most appropriate to the subject and your audience? The Color Schemes, Clipart, Graphics and styling should be relevant to the subject matter and emphasis the objective.
The length and breadth of the Presentation should be well thought of in context to the size, mentality, social status and cognition of the audience. You should not use elaborated philosophical anecdotes in a presentation for junior school children or cartoon clipart and bouncy fonts in an official presentation. In both these cases it should be the other way round.
Rule 2 – Stick to Simplicity
As with any design, cut the clutter. Two font families is a good rule of thumb. No more than one graphic image or chart per slide is another good rule (excluding any corporate logo or other recurring element in the design).
Presenter's University suggests the 666 rule for simplicity in design –
No more than 6 words per bullet
No more than 6 bullets per image and
No more than 6 TEXT slides in a row.
Rule 3 – Be Consistent
Use the same colors and fonts throughout. For this purpose define your theme at the outset. Designing the Master Slide or Template ensures the consistency and integrity along the length of the presentation. Templates go a long way toward helping to maintain consistency.
Although there are innumerable ready templates available within office library and on internet, it is always a good idea to design and create a bespoke template for each presentation for two reasons –
1. It will give a unique and fresh look and feel to the visual
2. It could be crafted perfectly to enhance the message and objective.
Play with the RULES and victory will no longer be distant…
Thursday, March 11, 2010
Presentation - IV
If I am to speak ten minutes, I need a week for preparation; if fifteen minutes, three days; if half an hour, two days; if an hour, I am ready now. ~ Woodrow Wilson
Presentation is nothing but the sophisticated, prepared and focused manifestation of communication. So before trying to learn the types of presentation, let us see what Communication means and what the types of Communication are.
Wikipedia offers the apt definition of communication –
Communication is a process of transferring information from one entity to another. Communication processes are sign-mediated interactions between at least two agents which share a repertoire of signs and semiotic rules. Communication is commonly defined as "the imparting or interchange of thoughts, opinions, or information by speech, writing, or signs". Although there is such a thing as one-way communication, communication can be perceived better as a two-way process in which there is an exchange and progression of thoughts, feelings or ideas (energy) towards a mutually accepted goal or direction (information)
Now for the types of communication, let us consider FOUR basic types –
1. Verbal Communication
Verbal communication includes sounds, words, language and speaking. Speaking is an effective way of communicating and is again classified into two types viz. interpersonal communication and public speaking – which is more relevant to presentation.
Good verbal communication is an inseparable part of business communication. Fluent verbal communication is essential to deal with people in business meetings. Also, in business presentation self-confidence plays a vital role which when clubbed with fluent communication skills can lead to success.
Public speaking is another verbal communication in which you have to address a group of people. Preparing for an effective speech before you start is important. There are many public speaking techniques and these techniques must be practiced for an effective speech.
2. Non-Verbal Communication
Non-verbal communication involves physical ways of communication, like, tone of the voice, touch, smell and body motion. Creative and aesthetic non-verbal communication includes singing, music, dancing and sculpturing. Symbols and sign language are also included in non-verbal communication. Body language is a non-verbal way of communication. Body posture and physical contact convey a lot of information. Body posture matters a lot when you are communicating verbally to someone. Folded arms and crossed legs are some of the signals conveyed by a body posture. Physical contact, like, shaking hands, pushing, patting and touching expresses the feeling of intimacy. Facial expressions, gestures and eye contact are all different ways of communication.
3. Written Communication
Written communication is writing the words which you want to communicate. Good written communication is essential for business purposes. The written communication can be edited and amended many times before it is communicated to the second party to whom the communication is intended. This is one of the main advantages of using writing as the major means of communication in business activity. Written communication is used not only in business but also for informal communication purposes.
4. Visual communication
The last type of communication is the visual communication. Visual communication is visual display of information, like, topography, photography, signs, symbols and designs. Of all the types this type of communication has a major part in any presentation. Apart from Presentation Television and video clips are the electronic forms of visual communication.
Today I will conclude on the note that Presentation is nothing but a developed and finished form of Visual Communication that can include Text, Tables, Graphs, Charts, Pictures, Graphics, Drawings, Designs, Signs, Symbols and even audio and video.
Wednesday, March 10, 2010
Presentation - III
SIX Steps to a Successful Presentation
1. Establish objectives for the presentation
What is the PURPOSE of your presentation?
What is your bottom line message?
What facts do you want them to learn and recall?
What value(s) do you want your group to leave with?
What action do you want them to take?
2. Analyze your audience
Use an interactive form to collect information about your audience
Why YOU are selected or elected for this presentation?
What would be the anticipated size of the audience?
What is the mutually beneficial factor – the common thread?
What tools and equipment are available to you?
3. Prepare a preliminary design or plan for the presentation
This is your presentation agenda with an outline including key messages and activities
Determine in advance how you will handle issues like unrelated questions, difficult or demanding attendees, problems with facility or equipment (to name a few)
4. Select resource material for the presentation
Put some time and effort to research and analyze the subject matter
Get some relevant and catching pictures and graphics for your visual
Consider adding a continuous running movie as Header or Footer
If it is for any Brand focus on the continuous visibility of the brand/logo
Use some statistics to reinforce your statements
5. Organize the material for an effective presentation
Arrange and rearrange the sequence until you find it most effective
Crosscheck for all the fonts, images and movie clips are in place and running ok
Make sure the flow of the materials matches your objectives for the presentation
Run the test show on different machines with different configurations and screens
Check to make sure the materials are consistently formatted and attributed
6. Practice the presentation in advance
Practice helps you to become familiar with your underlying message(s), values and your overall pacing and diction.
In spite of the glares, DO NOT hesitate to rehearse your presentation anywhere at anytime
Invite friends and buddies to act as your audience and encourage them to ask questions, however stupid it may seem
Never try to make the notes by heart, try to understand them instead. You can always improvise the concept with reference to the time, spot and current situation
Tomorrow we will proceed to the types of Presentation.
Tuesday, March 9, 2010
Presentation - II
Basics of Presentation
Naturally much how you go about preparing depends on what kind of presentation you are going to make, how you feel about your subject, who your audience is and what method you are most comfortable with. If you have got a way of preparing presentation and your method works, great, nothing like that. Stick to it and take all the efforts to better and improvise it the next time. If you are the beginner and preparing for your first presentation, do some self-examination and find out what style and method suits your personality and try to adopt it. In the process you will develop your own style and method that will comfort you while bearing the fruits.
According to Hindu Philosophy anything in the universe passes through THREE phases of being generated, in operation and getting destroyed. This philosophy supports the name given to all the deities – GOD! G – Generator - the deity Brhama creator of whole universe, O – Operator - the deity Vishnu one who looks after the universe, D – Destroyer - the deity Shiva can destroy anything with the power of his 3rd eye. Similarly every Book, Play, Song and Speech or any expressing act for that matter has a beginning, middle and closing. This is an eternal successful formula which need not be improvised. Audiences and readers like structure in the books and the presentations they attend. Here are the Three parts spelled out more clearly –
1. The Beginning grabs your audience’s attention
2. The middle provides your audience with some key ideas or skills to think about and act upon.
3. The closing enables your audience to think and perform in a different way.
Remember these basics for any presentation and we will proceed to steps for a successful presentation, tomorrow.
Monday, March 8, 2010
Presentation - I
So far we learnt the basics of two types of documentation processes.
1. Typing and formatting Text to prepare documents
2. Using spreadsheets for the statistical data to generate tabulated info, charts and graphs
Today let’s move ahead to Presentation, the most important skill and tool to generate, share and make your ideas, knowledge and proposition most effective and widespread. Before proceeding let’s try to analyze the very concept of Presentation.
What is a Presentation?
No matter what form and tool it takes, presentation simply means expressing your Profile, Proposition or Prospect in the most creative, credible and convincible manner with a clear objective and detailed preparation. Let us take all the point in consideration one by one.
Profile
It could be of an individual, a company, a body, an organization, an initiative or any entity that is aspiring of achieving its objective with the help of communication.
Proposition
Any plan, scheme, proposal, anticipation, intention, offer or any idea waiting to be manifested and realized with effective application of mission statement.
Prospect
Any subject, object, product, service, course, material, system, process, structure or any visualization that needs to be offered to grab attention and appreciation.
Creative
The most talked about but less practiced approach to virtually anything! It is being extremely original and resourceful in your every act and activity.
Credible
Being Credible is more about perception and cognition. It takes honesty, believability, passion and confidence about the subject matter and respect about audience.
Convincible
If you can’t make your addressees buy your point, how would you make them to buy your Profile, Proposition, Prospect or Product? Convincing is imperative!
Objective
The very purpose of anything to be conveyed, may it be a document, presentation, visualization or simple initiative! Find the Purpose, means will follow…!
Preparation
The most ingenious yet most ignored element of any effort instrumental in its success or failure. In plain school words – Home Work! If you do not complete it in a clean and neat style you don’t get the stars! Simple…!
Tomorrow we will try to learn some Basics of Presentation.
Sunday, March 7, 2010
Excel - VII
In a Nutshell
Excel is the most vast and comprehensive application from the MS Office suite. What is the potential of Excel is simply beyond the scope of this article! But here we can get a simplified brief of what Excel is all about.
1. First thing Excel does is it helps you get rid of the calculator
a. Use simple formulas for simple calculations and keep your results updated.
b. Different functions under various categories can perform complex operations.
c. Get the statistics not just right but updated to the last minute or even second.
d. Cross-links and inter-sheet references can use the data spread all over the workbook.
e. With apt function get time spend on a project or interest paid for a loan with just a click.
2. The structure of excel, combination of horizontal Rows and vertical Columns generate
a. Enormous no. of cells for virtually any size of data to fit in a worksheet
b. With Auto Fill feature, you can add Standard and Custom lists by typing just first letters
c. For easy navigation and control freeze panes with header (title) rows or columns.
d. Every cell in a worksheet has a unique address that makes moving in worksheet easy.
e. Use Conditional Formatting for shading and highlighting cells belonging to given criteria.
3. Generate and add stunning Graphs and Charts to elaborate the point
a. Excel generates quick Charts / Graphs from the selection
b. The look, feel and structure of Charts / Graphs can be easily customized with Format.
c. Graphs / Charts are linked to the data which means it gets updated with change in data.
d. Charts can be printed to any required size on any desired media.
e. Being Vector-based, quality of Graphics in a Chart is good enough for viewing/printing
4. Analytics with Excel are simply superb
a. Features like Pivot Table are handy for rearranging and analyzing data as desired.
b. Interactive and dynamic characteristic of Functions and formulas makes statistics easy.
c. Validating feature of the data gives you control of maximum accuracy and zero error.
d. Imported data from other applications can be customized according to categories.
e. Tools like Sort and Filter rearrange the data in desired sequence / criteria.
5. Your sensitive and crucial data in Excel is safe as you can
a. Hide the rows and columns that you don’t want to display.
b. Wipe out the selected data making it invisible yet available.
c. Protect your worksheet/workbook with a password
d. Lock or block the contents of selected cells to avoid accidental loss of data.
e. Automatically save / recover workbook in case of accidental closure
6. Printing and saving with Excel
a. Print preview can be used to control the appearance of the printed sheet
b. Decide what is to be printed in the Print dialogue with Range / Pages / Sheets / Selection
c. You can adjust the Scaling option or Fit to option to ensure nothing is omitted in print
d. Add Headers and Footers to all the sheets – either from the list or Customize your own
e. Excel supports different formats for saving a workbook including flexible CSV format
7. Excel works for you as a statistician and record keeper
a. Store huge data in a single worksheet
b. Use functions from various categories to make the equations and analyze results
c. Take care of validity and relevance of the data with no. of analyzing features
d. Keep track of gigantic data by Validation, Consolidation and What-If analysis
e. Get a real picture of the status with vivid Charts, Graphs and SmartArt Graphic
Saturday, March 6, 2010
Excel - VI
Times in Excel
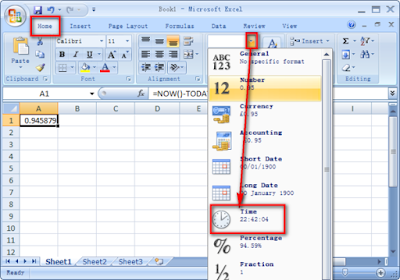
If you are keeping a regular track of it, let's now look at Times in Excel, as promised yesterday! While dates in Excel are seen as whole numbers (serial numbers) Starting from 1, Times are seen as a portion of a day (decimal fractions) with 1 being equal to 24:00:00 or a whole day. This means that:
24:00:00 is equal to 1
18:00:00 is equal to 0. 75
12:00:00 is equal to 0. 5
6:00:00 is equal to 0. 25
We can see this by entering any one of the above times in Excel and then formatting the cell containing the time as General, just as we did with the date. There are only three ways you can enter a valid time in Excel.
Make sure your cells are formatted as General
To enter a time based on a 12-hour clock, type the time followed by a space and then AM or PM. eg: 5:30 PM
Type the time followed by a space and then A or P. eg 5:30 P (Excel will convert this to 5:30 PM)
To enter a time based on a 24-hour clock, type 17:30
If you just typed 5:30 Excel will (by default as your cells are formatted as General by default) base your time on the 24-hour clock and store your time as 5:30:00 AM. In other words by default it sees all unspecified times as 24-hours but stores them based on a 12-hour clock.
The easiest way to see this is to type 5:30 in any cell, then select that cell and look in the Formula bar. No matter which method we use to enter times we must separate the hours, minutes and seconds by a : (colon). If we omit the minutes and/or seconds Excel will (by default) assign zero minutes and/or zero seconds. So entering a time, as 5 P will force Excel to see it as 5:00:00 PM. Obviously this is not the case for a time entered based on a 24-hour. Entering 17 will be seen as nothing more than the number 17.
Entering a Date and Time in Excel
Now that we have covered the fundamentals of dates and times, we can have a quick look at entering dates and times into the same cell. To enter a valid date and time in the same cell, you simply type any valid date, then a space and then any valid time. Excel will then store this as a whole number for the date (serial number) and a portion of a day for the time. (decimal fractions).
Try this:
Type the date and time 12/12/2004 18:00 in any cell
Right click in the cell and select Format cells and click the Number tab, then General under Categories:
Look in the Sample: box and you should see 38333. 75, where 38333 represent the date (serial number) and . 75 represents the time (decimal fraction).
Friday, March 5, 2010
Excel - V
Dates in Excel
You will find that Dates and Times in Excel can often seem confusing! But they often play a critical part in most spreadsheets so it is important that we have an understanding of how Excel interprets them.
How we enter dates in Excel is extremely important. If we do not insert a date in a valid form, Excel will not know that it is a date. One should be able to tell immediately if a date we enter is valid or not as Excel will align a valid date to the right of your cell (Number) and align a possible invalid date to the left (Text). When Excel recognizes a date as a valid date it will change from the General format (default for all cells) to a built-in date format.
When we enter dates on a Worksheet we must also use a valid date separator, such as 03/05/2010 or 03-05-10. If we want our date to look different to this we must format it after we have entered it. Lets try a couple of simple exercises to practice what we have learnt.
In cell A1 type: 03/05/2010 or 03/05/10. Both are valid.
Select Cell A1 and right click, then select Format Cells and then click the Number tab. This dialog box is the Format Cells dialog box. This is where we can apply formatting to both the cells themselves and the data contained within them. Click General under Categories. Now look in the Sample: box (top right). You should see the number: 40301. This is the number for our date: 03/05/2010 . This is because the this date is 40301 days from the 1/1/1900. Now select Date from within the Categories: box.Click through all the different dates within the Type: box and see the result in the Sample:: box. Select the format 3/14 and then click OK
Your date should now appear as 5/3. I say appear because while we may have changed its appearance we have NOT altered its underlying value which is 03/05/2010 or 40301. If you are still selected in cell A1 look in the formula bar and you should see 03/05/2010. So while it may appear we have dropped the year from the date we have not! In fact it is not possible to enter a valid date that has no Year, Day or Month. We could in fact format this cell to appear as 1/1/1989 and still have the true value of 03/05/2010 or 40301.
If we enter a date into Excel and omit the day eg; Dec-2009 Excel will recognize this as a valid date, but you should be aware that Excel will (by default) assign the first day of the month to the date. This means that while you may only see Dec-2009 in the cell, the underlying value of the date will be 12/1/2009 or 40148. This means that it is not possible to have a valid date in Excel that does not have a day of the month assigned to it.
We will discuss about TIME tomorrow as its time to say Goodbye!
Thursday, March 4, 2010
Excel IV -
Go To Cells Quickly
Go to --- F5
The F5 function key is the "Go To" key. If you press the F5 key, you are prompted for the cell to which you wish to go. Enter the cell address, and the cursor jumps to that cell.
Press F5. The Go To dialog box opens.
Type J3 in the Reference field.
Press Enter. Excel moves to cell J3.
You can also use Ctrl+G to go to a specific cell.
Hold down the Ctrl key while you press "g" (Ctrl+g). The Go To dialog box opens.
Type C4 in the Reference field.
Press Enter. Excel moves to cell C4.
You can also use the Name box to go to a specific cell. Just type the cell you want to go to in the Name box and then press Enter.
Wednesday, March 3, 2010
Excel III
Formulas in Excel
Formulas are entries that have an equation that calculates the value to display. We DO NOT type in the numbers we are looking for; we type in the equation. This equation will be updated upon the change or entry of any data that is referenced in the equation.
In our example, the solution was $252.61This was NOT typed into the keyboard. The formula that was typed into the spreadsheet was:=PMT(C4/12,C5,-C3)
C4 (annual interest rate) was divided by 12 because there are 12 months in a year. Dividing by 12 will give us the interest rate for the payment period - in this case a payment period of one month.
It is also important to type in the reference to the constants instead of the constants. Had I entered =PMT(.096/12,60,-12000) my formula would only work for that particular set of data. I could change the months above and the payment would not change. Remember to enter the cell where the data is stored and NOT the data itself.
Formulas are mathematical equations. There is a list of the functions available within Excel under the menu INSERT down to Function.
Formulas OR Functions MUST BEGIN with an equal sign (=).
Again, we use formulas to CALCULATE a value to be displayed.
If you work for 23 hours and make $5.36 an hour, how much do you make? We can set up this situation using
three labels
two constants
one equation
Let's look at this equation in B4:
= B1 * B2
= 23 * 5.36
It is BEST if we can Reference as much data as possible as opposed to typing data into equations.
Tuesday, March 2, 2010
Excel II
- Labels - (text with no numerical value)
- Constants - (just a number -- constant value)
- Formulas* - (a mathematical equation used to calculate)
Data types
LABEL - Name or Wage or Days - anything that is just text
CONSTANT - 5 or 3.75 or -7.4 - any number
FORMULA - =5+3 or = 8*5+3 - math equation
*ALL formulas MUST begin with an equal sign (=).
Labels are text entries. They do not have a value associated with them. We typically use labels to identify what we are talking about.
In this example: the labels are
- computer ledger
- car loan
- interest
- # of payments
- Monthly Pmt.
Again, we use labels to help identify what we are talking about. The labels are NOT for the computer but rather for US so we can clarify what we are doing.
Constants are entries that have a specific fixed value. If someone asks you how old you are, you would answer with a specific answer. Sure, other people will have different answers, but it is a fixed value for each person.
In our example: the constants are
$12,000
9.6%
60
As you can see from these examples there may be different types of numbers. Sometimes constants are referring to dollars, sometimes referring to percentages, and other times referring to a number of items (in this case 60 months).These are typed into the computer with just the numbers and are changed to display their type of number by formatting (we will talk about this later). Again, we use constants to enter FIXED number data.
Monday, March 1, 2010
Excel I
- Columns
- Rows
- And their intersections are called cells
- Text (labels)
- Number data (constants)
- Formulas (mathematical equations that do all the calculation)
In a spreadsheet the COLUMN is defined as the vertical space that is going up and down the window. Letters are used to designate each COLUMN'S location.
In the above diagram the COLUMN labeled C is highlighted.
In a spreadsheet the ROW is defined as the horizontal space that is going across the window. Numbers are used to designate each ROW'S location.
In the above diagram the ROW labeled 4 is highlighted.
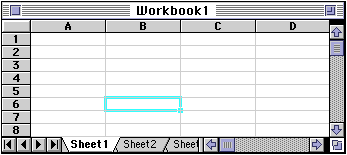
In a spreadsheet the CELL is defined as the space where a specified row and column intersect. Each CELL is assigned a name (Cell Address) according to its COLUMN letter and ROW number.
In the above diagram the CELL labeled B6 is highlighted. When referencing a cell, you should put the column first and the row second.